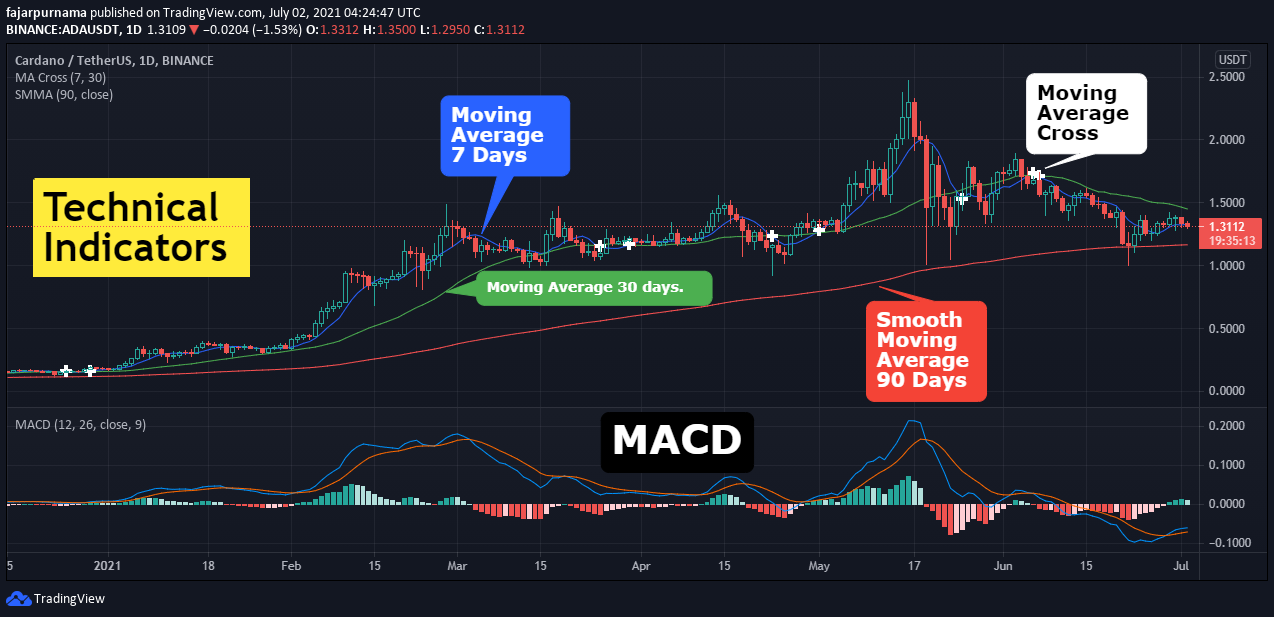
Overlays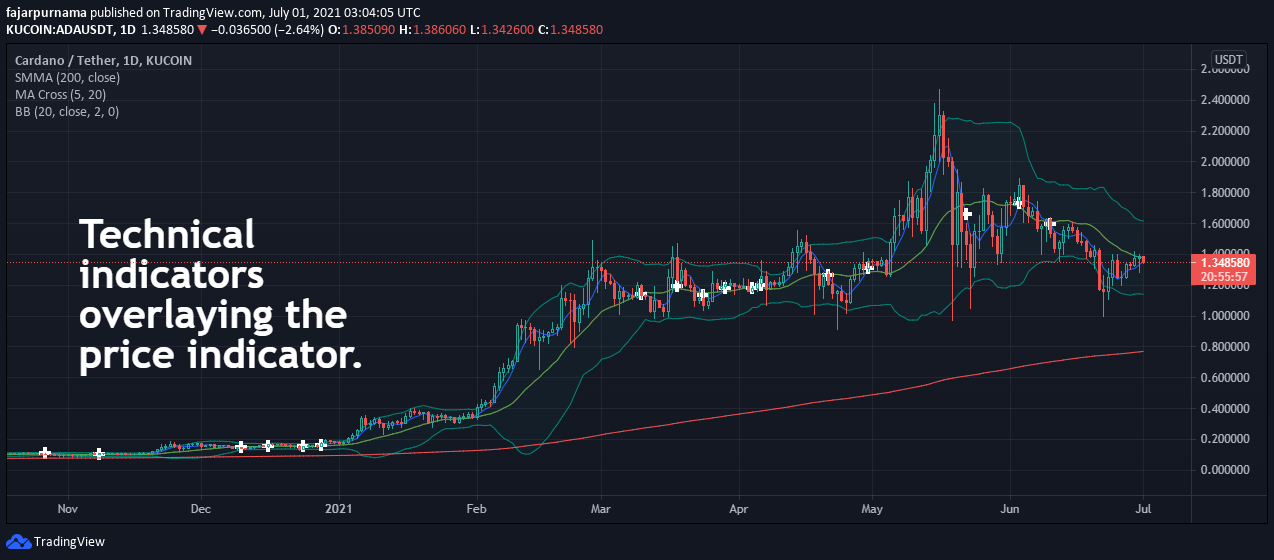
Moving Average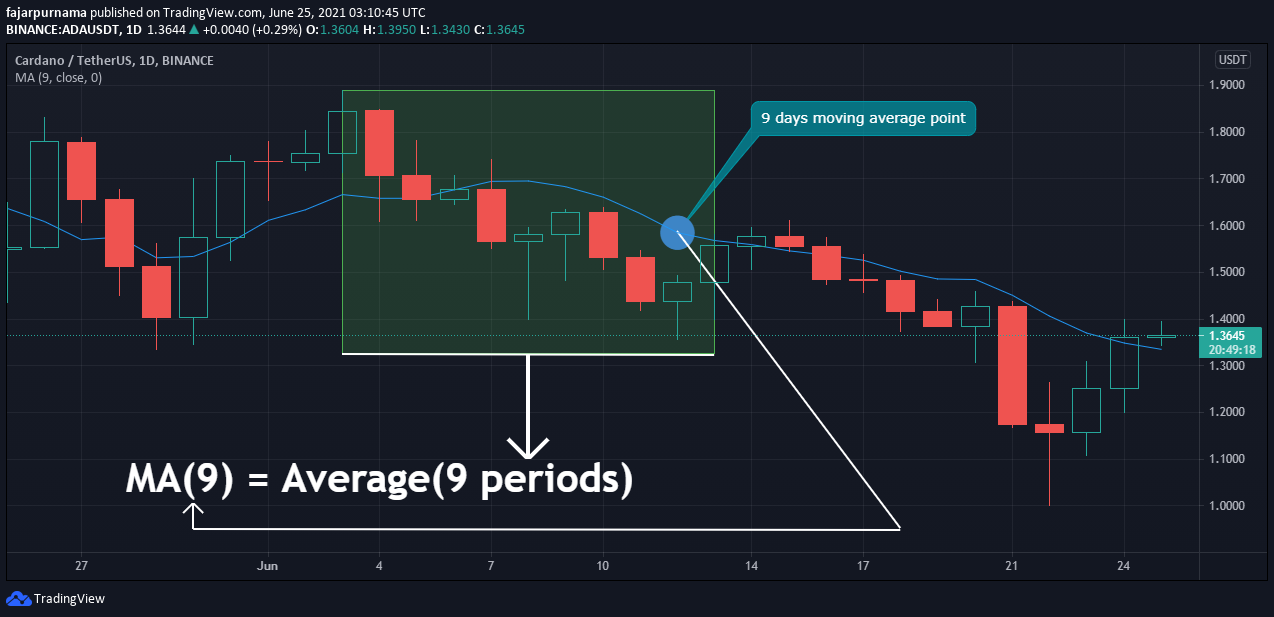
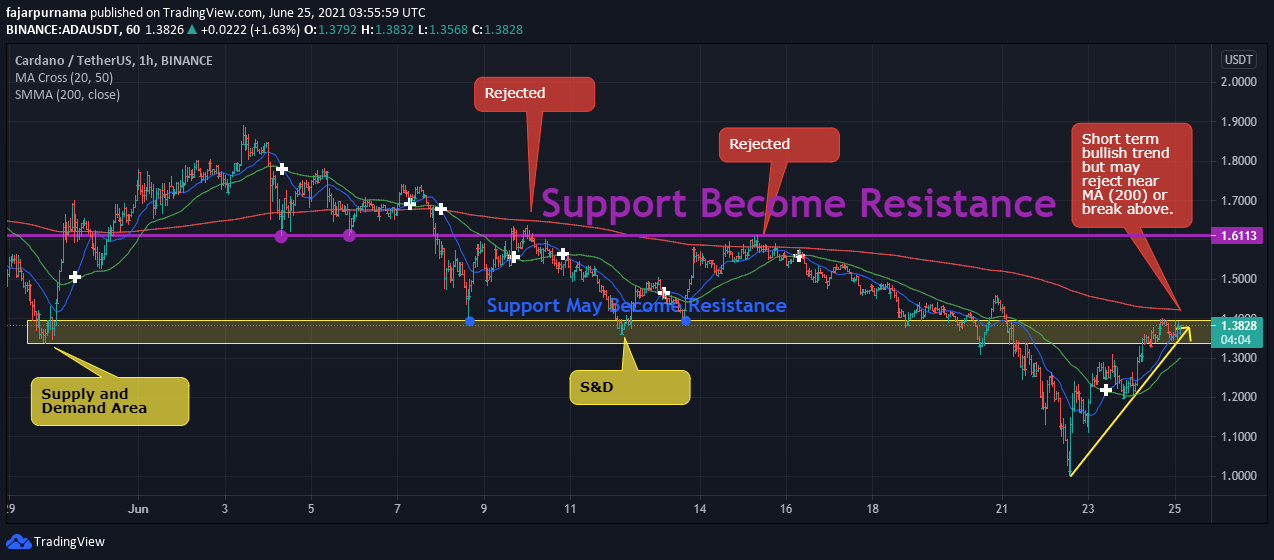
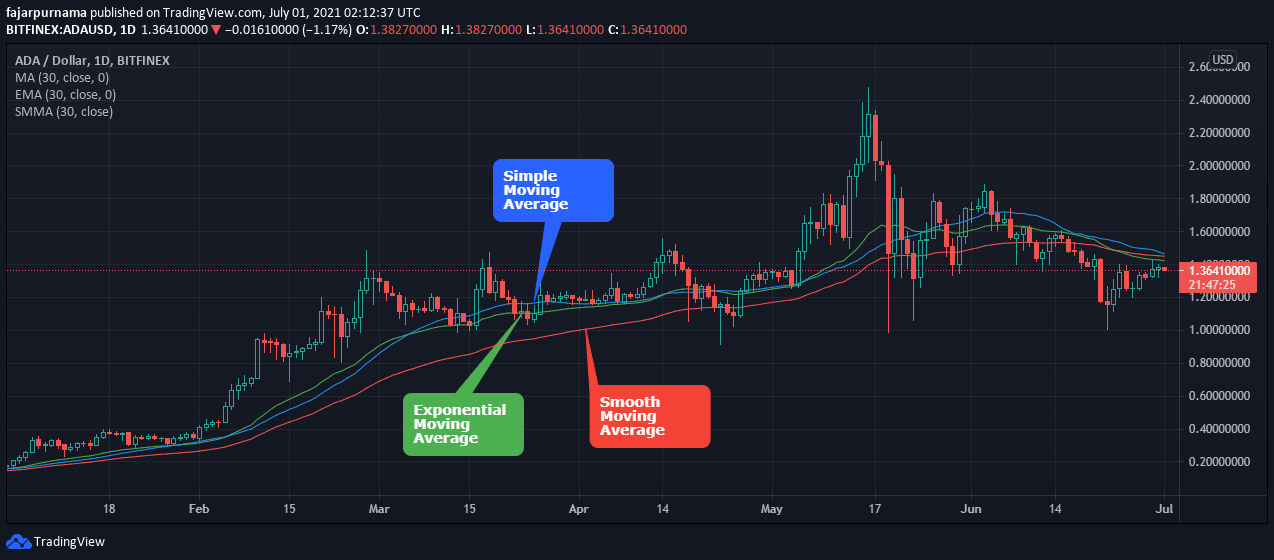
EMA(t) =[V(t) × (s/(1+d))] + EMA(y) × [1−(s/(1+d))] where: EMA(t) = Exponential Moving Average today V(t) = Value today EMA(y) = EMA yesterday s = Smoothing (typically [2/(d + 1)]) d = Number of days Bollinger Bands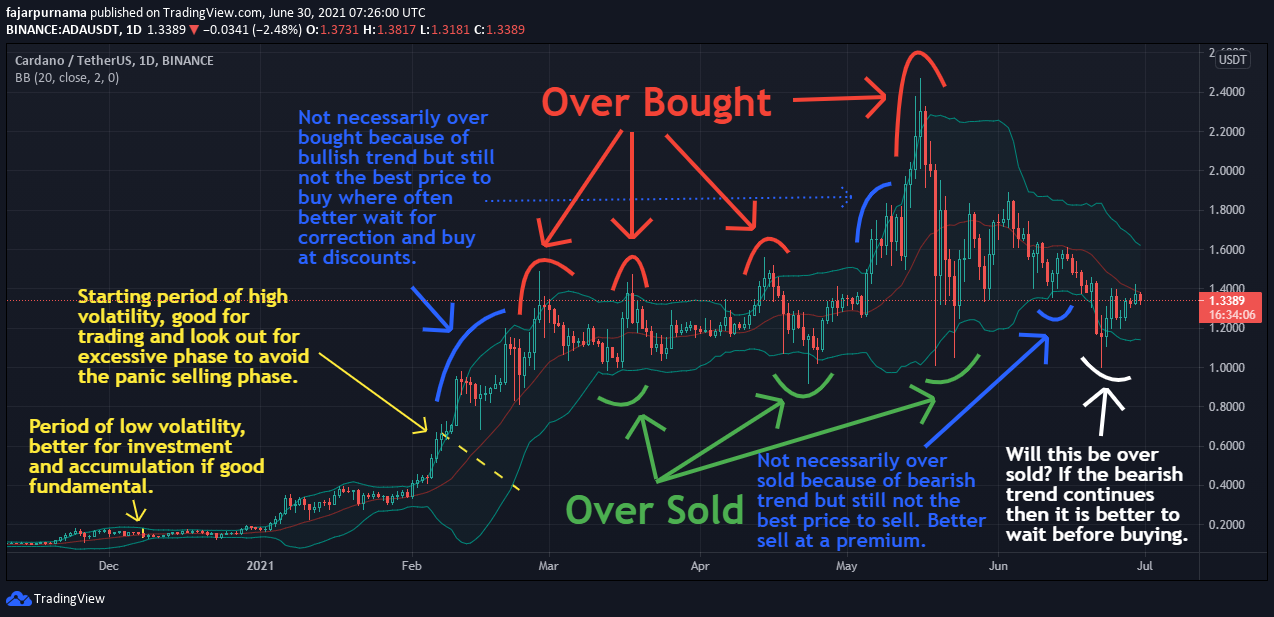
BOLU = MA(TP,n) + m∗σ[TP,n] BOLD = MA(TP,n) − m∗σ[TP,n] where: BOLU = Upper Bollinger Band BOLD = Lower Bollinger Band MA = Moving average TP: typical price = (High + Low + Close)/3 n = Number of days in smoothing period m = Number of standard deviations σ[TP,n] = Standard Deviation over last n periods of TP Oscillators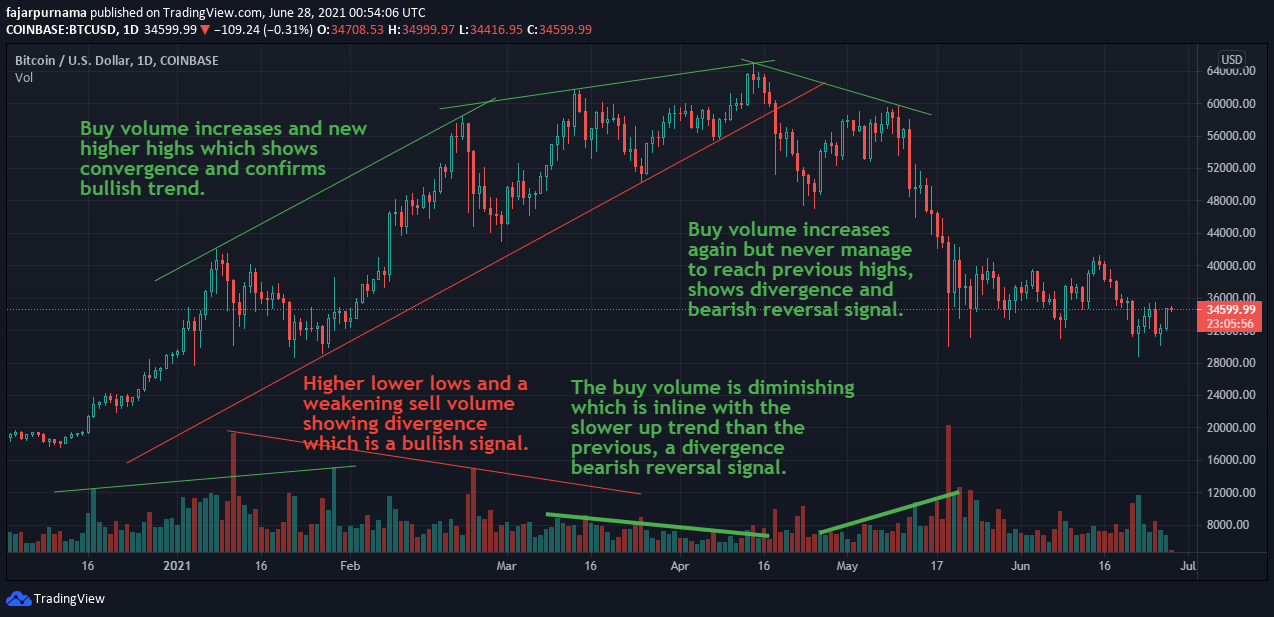
Stochastic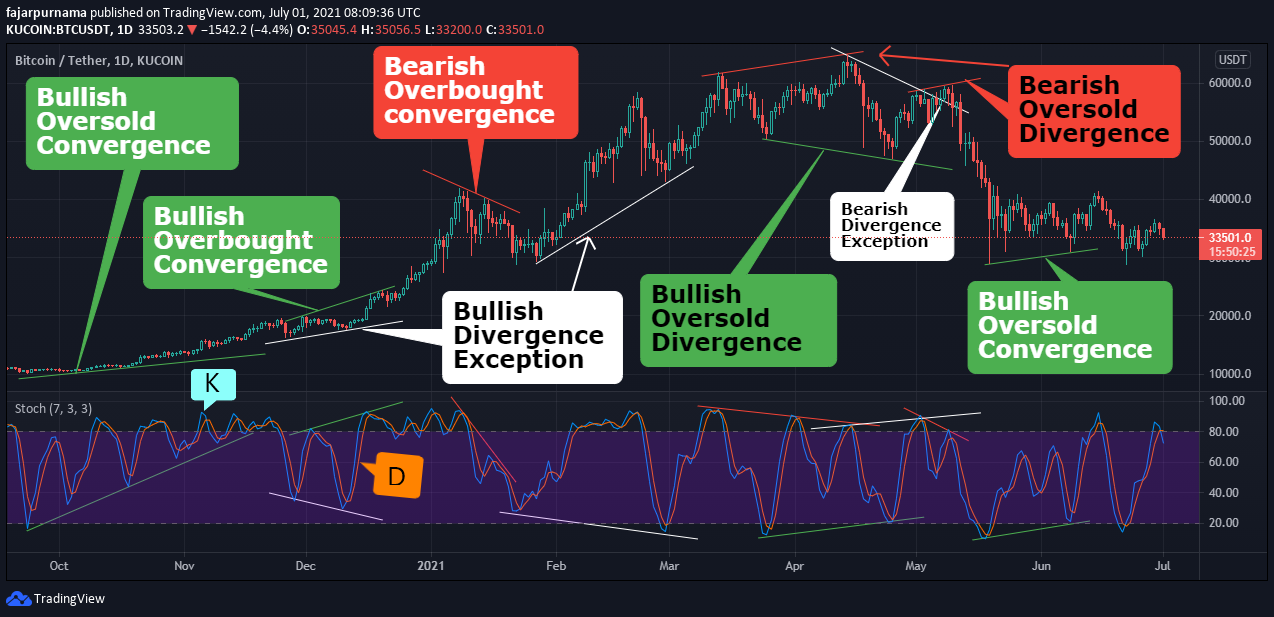
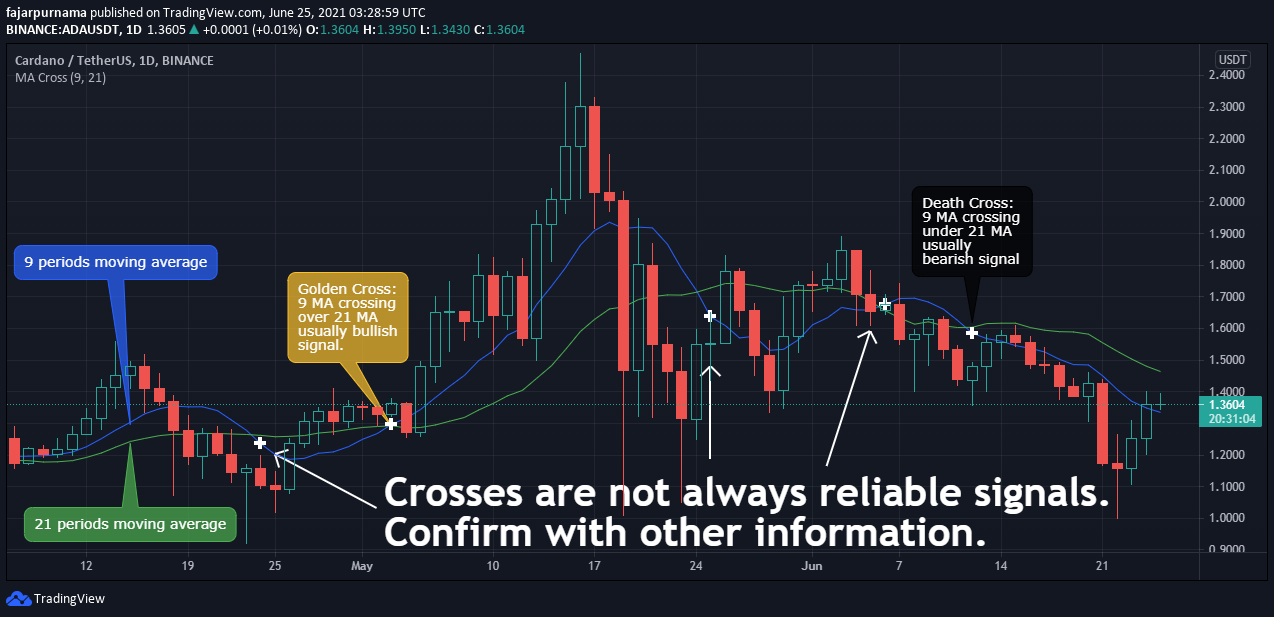
%K = 100 * ((C – L(N)) / (H(N) – L(N)) %K is the derived indicator value C is the current price point L is the lowest price point over a specified period H is the highest price point over a specified period N is the defined period %D = (K1 + K2 + K3) / 3 %D is 3 periods moving average of %K values Even I now I do not understand what stochastic is except for the definition in the dictionary "pertaining to conjecturing" and in Greek dictionary is "to aim at a mark, guess". I can only guess that it has something to do with random variables. For stochastic oscillator, I decided to look at the formula instead to understand the meaning and I found that it is to find whether the current price is cheap (oversold) or expensive (overbought) compared to the previous price. For example, this week the price ranges from $1 - $10, what does $7 means? It means that the distance between the lowest price is $7 and the distance between $10 is $3, it is the third highest price which some may see it as expensive. Today, a new price appears, $16, which is $15 distance from the lowest price $1 and $6 higher from the highest price $10. After checking the news and found no good enough reason, I will sell, who would be crazy enough to buy something this expensive? Anyway, the K is the stochastic oscillator value and the D is 3 periods moving average of K which is designed to be lagging. Just like golden and death crosses, when the 2 line intersects may signal a change of price direction. Moving Average Convergence Divergence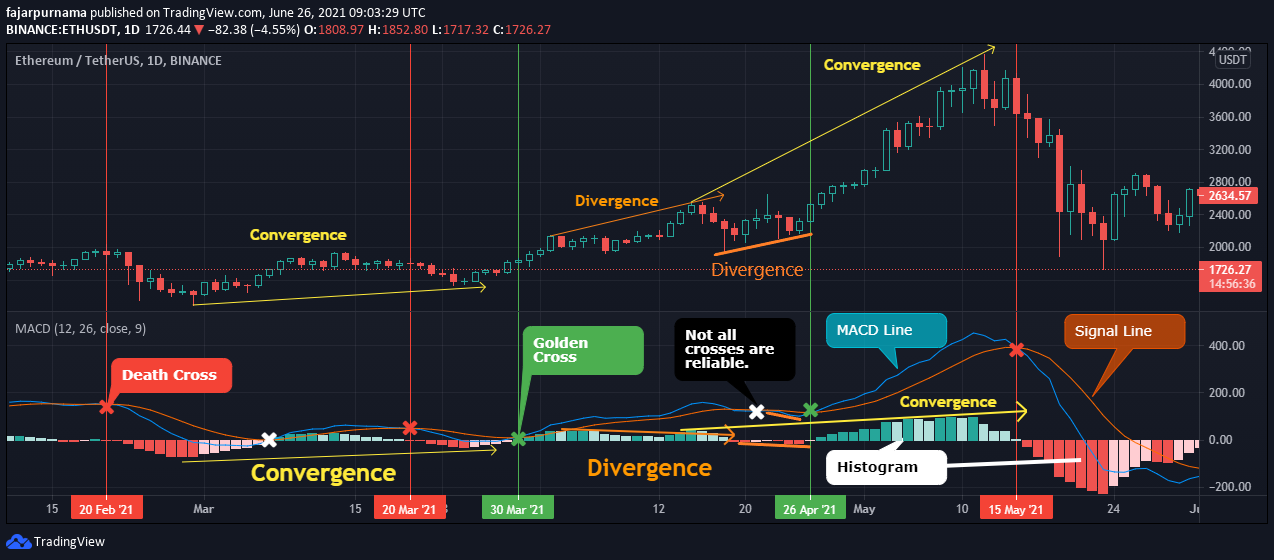
Final ThoughtsLike there are many candle stick patterns, there are many technical indicators. Like in the previous chapter where the popular candle stick patterns are enough to read the basics, the indicators above are enough to do basic technical analysis. Even advance traders does not use a large amount of candle stick pattern and technical indicators but continue their study to chart patterns, fibonacci sequence, harmonic pattern, etc, but ofcourse learning more can improve our analysis skills. I personally prefer honing the basic foundations such as learning all the candle stick patterns and all other indicators than rushing to the next level. Still, indicators are just one of the utilities that we can use in trading that we should not rely 100% on it. For example above, not all golden crosses and death crosses are relevant, not always a sell signal the moment an asset shows overbought and not always buy signal the moment an asset shows oversold, and not always a clear reversal on divergence. Therefore, we should not forget the basics such as drawing swings, trend lines, support & resistance lines, and supply & demand areas.
0 Comments
Leave a Reply. |
Archives
August 2022
Categories
All
source code
old source code Get any amount of 0FP0EXP tokens to stop automatic JavaScript Mining or get 10 0FP0EXP tokens to remove this completely. get 30 0FP0EXP Token to remove this paypal donation. get 20 0FP0EXP Token to remove my personal ADS. Get 50 0FP0EXP Token to remove my NFTS advertisements! |
 RSS Feed

